
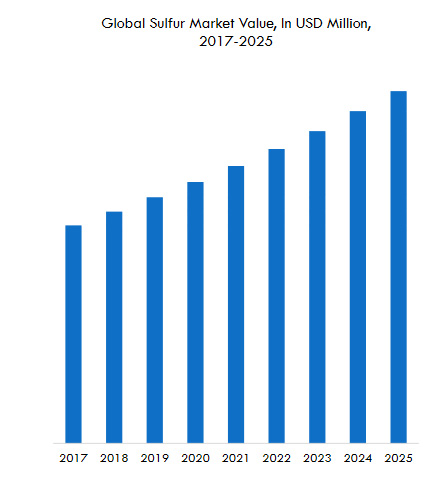
In this article of Venus Dream Deal website, we have a look at global sulfur market statuses from year 2019 to 2025 and give report in form of charts.
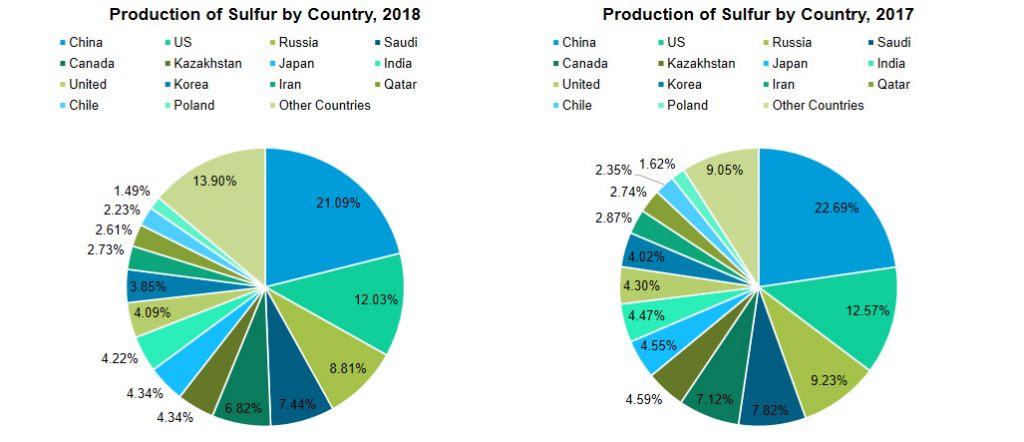
In Asia-Pacific region, China is the major country in production of sulfur in all forms. China is the world’s leading producer of pyrites, and also a leading sulfur importer. The demand for sulfur in the country is driven by end-user industries including chemical processing, fertilizer, and rubber processing industries.
Increase in energy production in China in recent decades across the oil and gas sector is likely to fuel the domestic sulfur recovery. Developments in the Sichuan province have led to a significant increase in sulfur production capacity.
Additionally, oil palm, rubber, and sugarcane accounts for almost 95% of ASEAN fertilizers demand. Cultivation is expected to be the main driver for the fertilizer growth in future which may leads to upsurge the sulfur market.
Thailand is one of the largest producer and exporter of natural rubber, globally. Around one-third of total global natural rubber plantations are across Thailand, Indonesia, and Malaysia. These factors are contributing to the increasing demand for sulfur consumption in this region during the forecast period.
Sulfur production from Frasch method for commercial scale was first carried out in Mexico and Brazil. Elemental sulfur is mined in Poland, Russia and China.
The sulfuric acid plant at Eurochem’s Lifosa phosphate fertilizer plant remains offline until early June due to a technical issue leading to the unscheduled stoppage and the maintenance programme being brought forward.
In Saudi Arabia there have been constant reports of some decrease in the availability of trader contract cargoes with some traders reporting no availability in third quarter year with tonnes reportedly being sought from JV operations. Saudi Aramco will be bringing on significant new Sulfur capacity at the gas based Fadhili plant in 2-half.
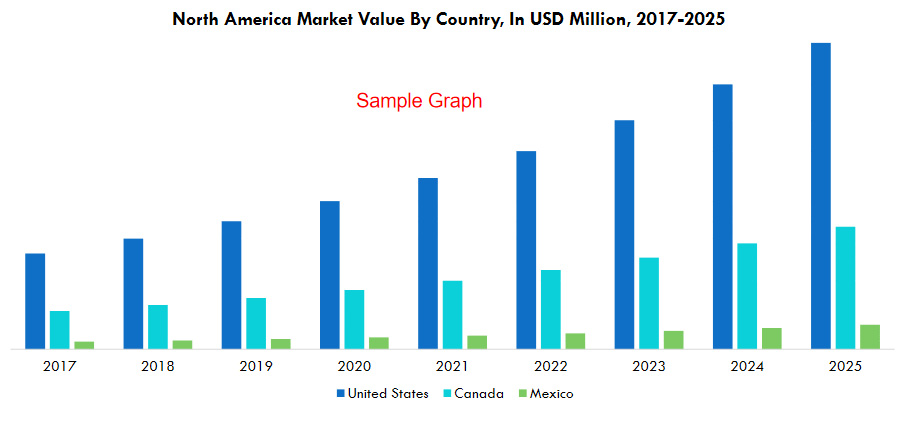
In Americas, increasing adoption of TPV in the automotive industry is the primary factor that drive the growth of the sulfur market in future.
The adoption of TPV provides manufacturers various benefits in terms of design flexibility, long-term weather resistance, and reduced cost that are not available with the traditional counterparts such as rubber and EPDM. As the TPV is manufactured using the dynamic vulcanization process and sulfur is used as an accelerator and curative in vulcanization process , this expands the demand for sulfur market. The United States is the second largest country in the production of sulfur.
The Russian crude oil to refineries via the Dhruzba pipeline is still condensed, with some estimates pointing to a potential delay of 6-8 months in re-establishing usual supply, which is causing sever demand-supply shortage to the market in the European region.
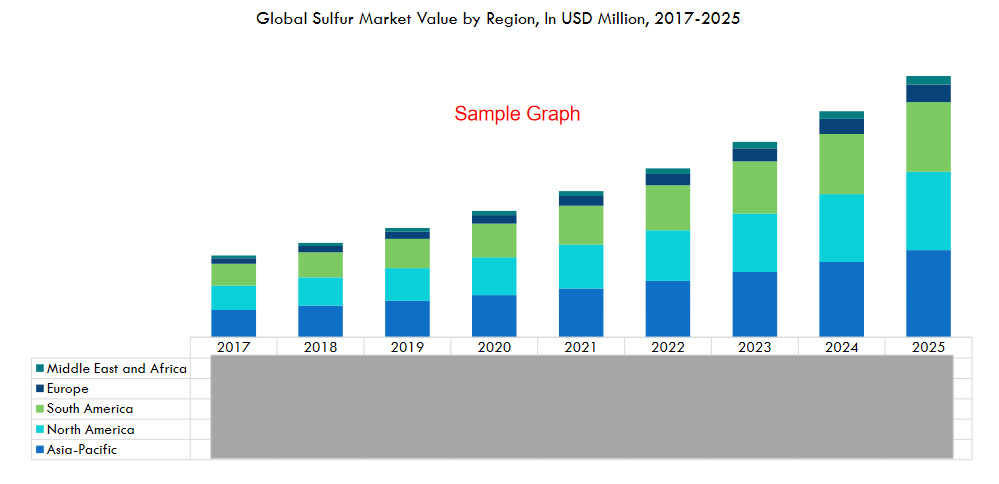
Germany and Central Europe sulfur market have become very tight as a result, and in some cases, there are reported to be disruptions to contractual volumes.
Two refineries in Germany supplied by the pipeline are reported to still be operating at reduced rates due to the closure of the Druhzba pipeline.
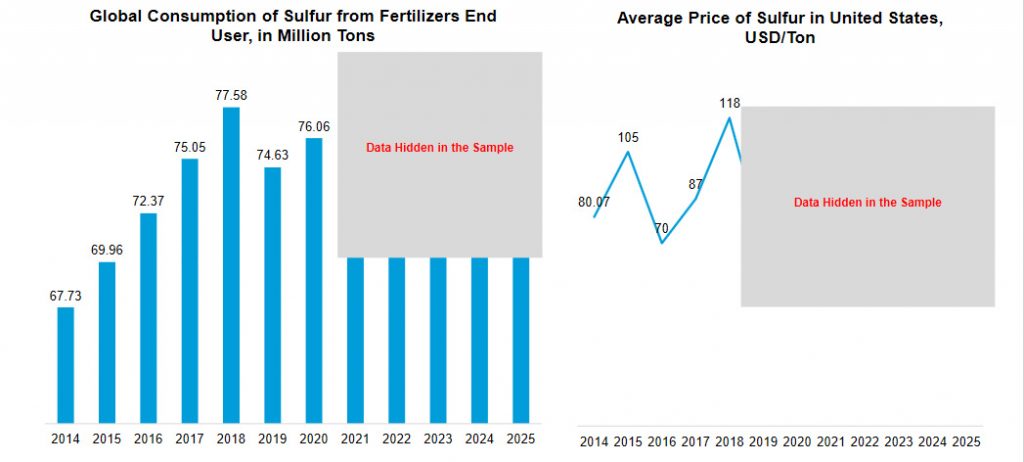
The global sulfur market by end user industry is segmented into chemical processing,fertilizer,rubber processing, metal manufacturing and other end user industries.
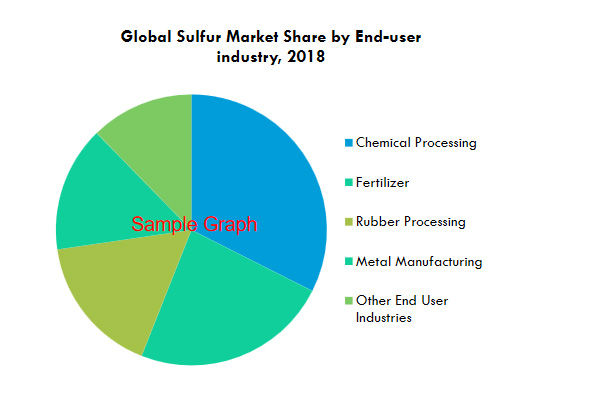
Among end-user industries, chemicals processing segment leads the demand for sulfur market. Additionally,rubber processing is anticipated to show the fastest growth during the forecast period.
Increasing application of sulfur in various industries such as automotive, metal forming, circuit board manufacturing, composite manufacturing, and others is boosting the market demand. With increasing production for rubber,the demand for sulfur is simultaneously increasing, which is used during the production process of rubber.
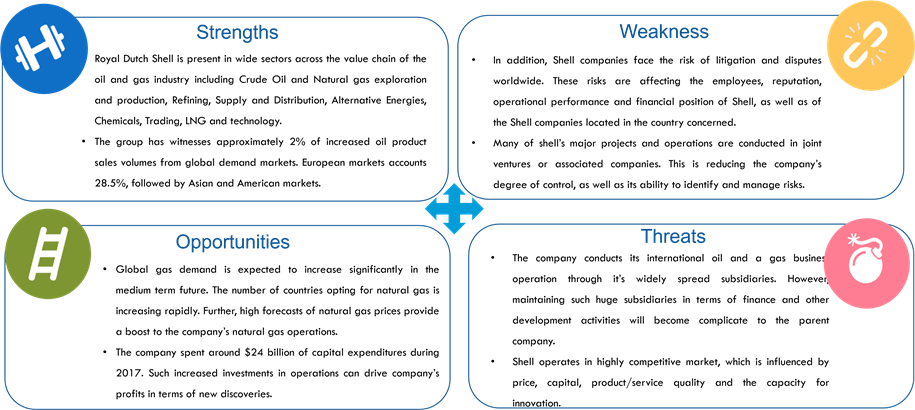
About ROYAL DUTCH SHELL PLC
| Shell | |
| Company Legal Name | Royal Dutch Shell Plc |
| Establishment/Incorporation (in Year) | 1907 |
| Company is Headquartered in | Netherlands |
| Phone No. | +31-70-377-9111 |
| Website | www.shell.com |
| Operating Regions | Global |
| Business Lines | Across Oil and Gas Value Chain |
| Corporate/Registered Address | Royal Dutch Shell plc, Shell Centre, LondonSE1 7NA, United Kingdom |
- Royal Dutch Shell Plc is one of the largest publicly traded, integrated international oil and gas companies in the world.
- The company is engaged in conducting various operations across the oil and gas value chain including upstream activities (Exploration and Production of crude oil and natural gas), midstream activities (transportation, shipping, LNG), downstream activities (Refinery, Supply, Trading, Shipping, Petrochemicals) and projects & technology services.
- The company was established in 1907 with the merger of Royal Dutch Petroleum Company and Shell Transport and Trading Company Ltd.
- Shell has refining and product distribution operations in Saudi Arabia. It conducts its operations through joint venture operations. Aljomaih and Shell Lubricating Oil Company (JOSLOC) and Saudi Aramco Shell Refinery Company (SASREF) are key joint venture companies of Shell located in Saudi Arabia.
- JOSLOC is responsible for marketing shell’s lubricants in the kingdom of Saudi Arabia, whereas, SASREF is engaged in crude processing and is one of the largest petroleum refining company in the country.
- The company has operations across the globe. Currently, it operates in 70+ countries. Over 90,000 employees and contractors work for the company. The super major is headquartered in The Hague, Netherlands.
| Table 40: Shell- Key Financial Indicators, $Million, FY2017 | |
| Parameter | Value |
| Total Revenue | 11,772.70 |
| Operating Income | 1,278.20 |
| Net Income | 1,787.20 |
| Basic EPS | 0.31 |
| Capital Expenditures | -390.3 |
| Cash from Operating Activities | 2,339.90 |
| Free Cash Flow | 1,949.70 |
| Total Assets | 19,208.40 |
| Total Liabilities | 5,162.70 |
| Total Long-Term Debt | 2,142.80 |
| Total Common Shares Outstanding | 5,833.80 |
| Market Cap | 20,171.40 |
| Table 41: Shell- Key Financial Ratios, $Million, FY2017 | |
| Profitability Ratios | |
| Gross Margin | 14.84% |
| Operating Margin | 10.86% |
| Pretax Margin | 18.61% |
| Net Profit Margin | 15.18% |
| Financial Strength | |
| Current Ratio | 3.08 |
| Long-Term Debt/Equity | 0.18 |
| Total Debt/Equity | 0.28 |
| Interest Coverage | 29.72 |
| Management Effectiveness | |
| Return on Assets | 9.74% |
| Return on Equity | 16.06% |
| Efficiency | |
| Receivables Turnover | 12.78 |
| Inventory Turnover | 7.53 |
| Asset Turnover | 0.64 |
Research Methodology
- With over 10 years of industry experience, OG Analysis has developed a robust and widely trusted methodology for assessing market sizes, market shares and forecasts. All our research reports are provided through intense and repetitive primary and secondary research methods. Further, these reports are validated with industry experts to ensure reliability in the current scenario.
- Our internal experts continually focus on the key events happening in the industry and analyze its implications on each market and the industry as a whole. The information in our reports is gathered from various secondary sources including
- Company websites and annual reports
- Company Filings
- Press releases and press coverage
- Government Statistics, Customs and Other Data Sources
- Ministries and Embassies
- Industry Organizations and Associations
- Primary research through telephone conversations and e-mails
Research Methodology
OG Analysis adheres to strong research methodology in all its reports and databases. Our transport and traceable methodology ensures strong management of research process and quality control of research at all stages.
We understand that all our information and insights are used for making top level decisions, which require reliable and citable data. Our data is continuously validated by in-house and industry experts to provide high quality and reliable reports. Our databases are updated on a daily basis, which ensures that all the data, analysis and recommendations in our reports are up to date.
Transparent and Traceable Methodology
Our large and experienced team of in-house experts continuously works on database update through sound research practices. Our reports seek data from these databases and other statistical reports, surveys and interviews, all of which are verified with a variety of standard and sophisticated analytical techniques. The final copies of our reports are sent to our industry expert team, which consists of professionals currently working in global oil and gas industries.
Unbiased and Independent Opinion
OG Analysis provides complete unbiased insights in all its report publications. Our report views are independent and are largely fact based. We acknowledge the market consensus view but we are not afraid to oppose in necessary cases. Our views are validated with industry experts, which ensure that our analyses are always in the right direction. In case our views vary from the client’s view, our analysts are always ready to discuss our findings directly with clients.
Clear Conclusions and User friendly Presentation
All our reports provide clear and actionable conclusions on all aspects. In addition to providing whole picture, we ensure that our insights are logical, practical and most applicable in key decisions.
In addition, all our insights and conclusions are presented in an easy to use format. Information is analyzed through sophisticated techniques and is presented through most innovative charts, tables and figures.
- The base currency considered was the United States Dollar (USD). The conversion of other currencies to USD was considered based on the average exchange rate for the respective review period years. The exchange rate conversion for forecast period was determined according to the base year’s conversion rates.
- The base year was identified based on the availability of annual reports and secondary information. The base year considered for this study is 2018.
- The review period considered for this study is from 2014 to 2018. CAGR is estimated for 2019-2025, which is the forecast period considered under the study.
- Market size estimations for the forecast years are in nominal terms. Inflation is not considered for price calculations and the Average Selling Price (ASP) was kept constant through the forecast period for each country.
- Distribution of primary interviews conducted was based on the regional share of the market and the presence of key players in each region.
- As a result of data-triangulation through multiple methodologies and approaches, the weighted averages of resulting estimates were considered to be the final values.